
Integrated Distribution Design is More Efficient
Intelligent integration reduces design time by over 50%
Intuitively, it makes sense that integration of utility distribution design with other information systems like GIS, financials and materials management would be a smart thing to do. A recent presentation at the SBS Peer Utility Group gave us some proof to confirm our intuition.
The client, Nashville Electric Service, generated the same designs for overhead residential and underground residential development under four different levels of integration. The first case was with the AutoCAD Map3D product. The second case introduced the Automated Utility Design™ product from SBS. Case 3 provided comprehensive GIS integration and the final case involved full integration with enterprise resource planning (work management, financials and materials management). Here are the findings:
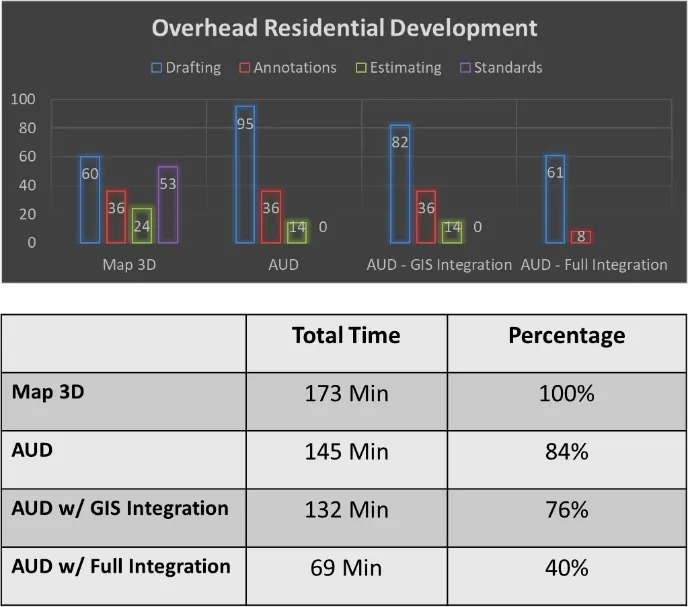

Moving from CAD to AUD offered nice efficiency improvements, ranging from 16% for overhead designs to 22% for underground residential development designs. Some of benefits were derived from having calculations performed behind-the-scenes during feature placement, as well as the integration of estimation from the automated generation of bill of materials. The majority of the benefits came from the complete reduction of the need to look up, find or otherwise investigate engineering and drafting standards that were used during design.
 The integration of GIS also provided notable benefits, ranging from 8 to 16% improvement. With the addition of the SBS Utility DataHub™ (UDH) for GIS Integration, we begin to see a drop in drafting times. This is expected, as UDH allows an AUD user to retrieve landbase, existing features (with attribution and connectivity) and other data from the GIS. This nets us another increase in Design Throughput of approximately 10% (8% OH, 14% UG).
One would expect that there would be greater productivity gains with GIS integration, but it is important to note that this study was for the design component only. Redrawing into the GIS is significantly reduced, but is not addressed in this analysis.
By far, the most significant reduction comes with the addition of what NES calls the “Full” integration, which is supported by another component of Utility DataHub™ that allows for communication with a work management, financial and materials management systems. This also includes the addition of configuration to generate annotation, schematics and call-outs for various features on user-demand. It is under this last scenario where we see a huge increase in design throughput – approximately a 35% jump in just this one step (36% for overhead designs, 34% for underground)! By not manually generating the annotation-type features required to produce a worthy construction print, the designer can see large decreases in drafting times. Similarly, not having to manually re-enter a bill of material into work management also increases design throughput (and reduces errors).
So, what does it all mean? In this case, our intuition was correct! A 60 to 72% reduction of time spent in many types of design provides the very significant gains in productivity that all companies desire as they seek to become more efficient and competitive.
But it’s not just “faster design”, right? As a portion of the savings comes from Construction Standards being built into the system, these designs are correct as well as fast. Time savings like these might also help alleviate some of the stresses of our retiring engineering workforces. And…these types of measurements also provide a great roadmap for determining the ROI you might achieve with a similar project. All “smart things to do”!
What kind of conclusions do you draw from this data? We look forward to hearing from you.