SBS announces new enhancements to industry-leading AUD infrastructure design application
SBS is pleased to announce extensive enhancements to our industry-leading Automated Utility Design (AUD) product to support the needs of telecommunications design professionals. AUD has had a very successful track record for electric and gas utilities by automating many of their design calculations and workflows while integrating with related business systems such as GIS, work and asset management and mobile applications.
When we set out to take AUD to the next level for communications organizations, we focused on addressing some of the key needs we have seen in the marketplace. With those needs in mind we set out with to accomplish the following objectives:
- Deliver a modern, model-based design platform, thus ensuring that the design is based on real-world models (known as digital twins) that can support not just design, but the engineering, construction and operational needs of the communications industry
- Leverage the best of the leading platforms, in this case, AutoCAD (with Map3D extensions) and ArcGIS professional with Esri’s Utility Network. By doing this we our goal has been to minimize the amount of custom development while relying on well-established user-interfaces, data management capabilities and an extensive support and training ecosystem.
- Build an open and integrated environment that supports multiple vendors. This not only streamlines design and work management workflows but also serves to support the next generation of application innovations in the communications industry. This includes BIM, mobile computing, digital twins and augmented reality.
We are very excited about the results we have achieved to date. Here are some of the exciting things AUD for Communications has to offer:
CAD and GIS Application-Level Interoperability
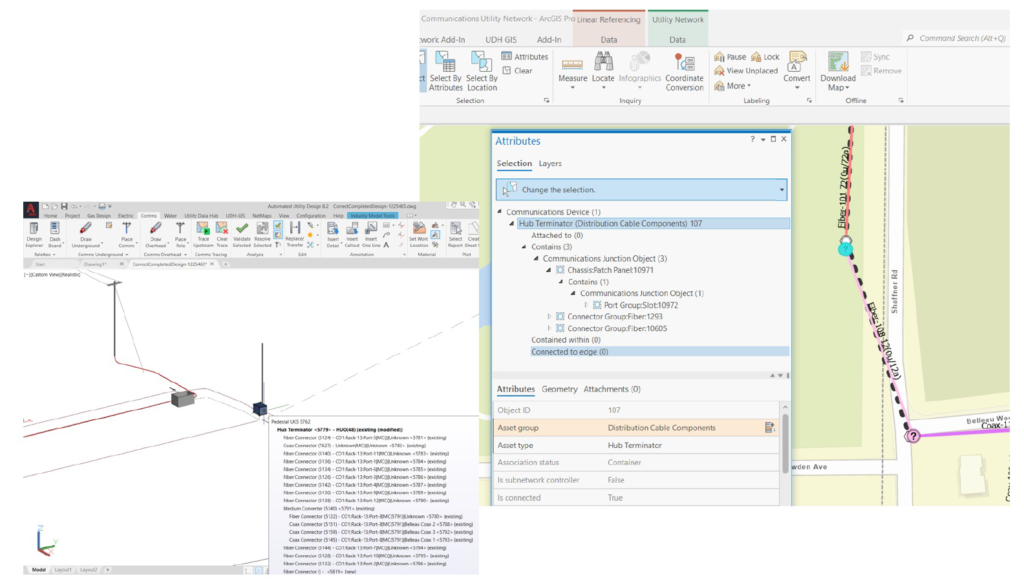
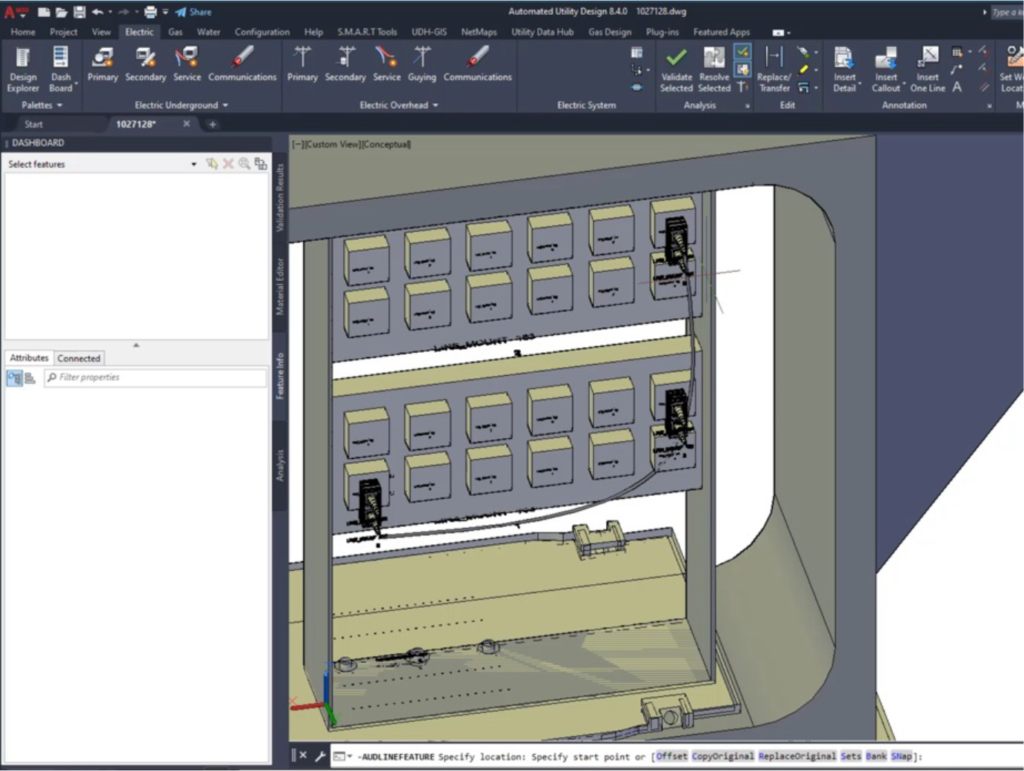
AUD for Communications has the familiar AutoCAD interface and the easy-to-use object placement menus of AUD, but it relies heavily on the use of ArcGIS and Utility Network to manage the complexity of telecommunications networks. This tight GIS interoperability is a new, more advanced level of integration over the way AUD is typically used for electric and gas utilities.
The figure below shows a fiber representation in both AUD and ArcGIS Utility Network, leveraging the Esri ArcGIS Utility Network Foundation for Communications. AUD for Communications has out-of-the-box alignment with this foundational data model but can also be configured to support other commonly used telecommunications models. This approach ensures that minimal data transformation is required between design and GIS, ensuring a single source of truth and a common platform for creating and managing digital twin representations of communications assets. An example is shown below.
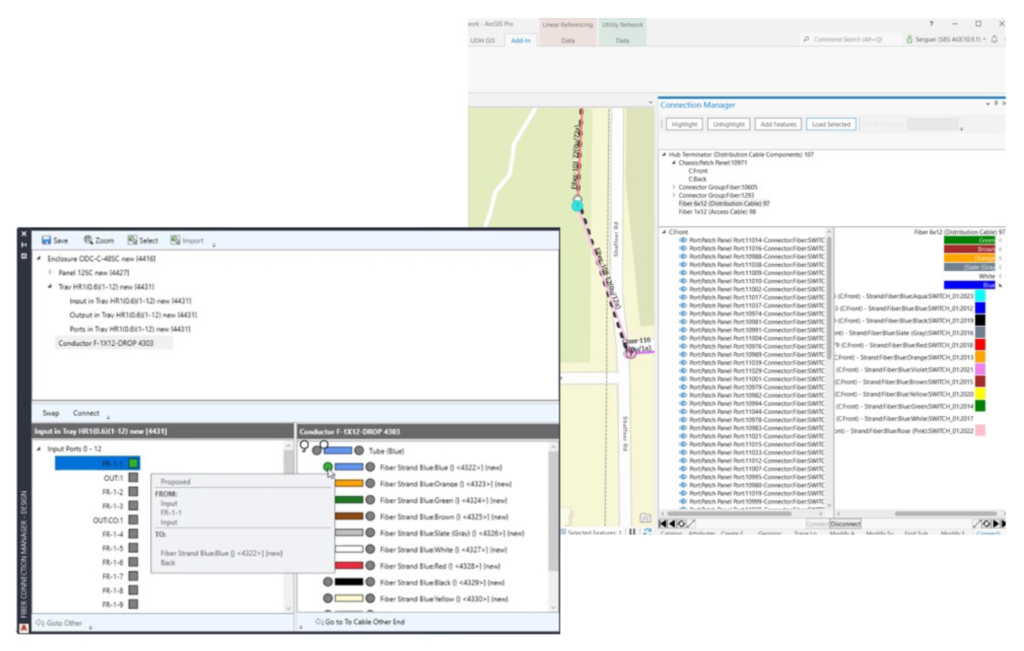
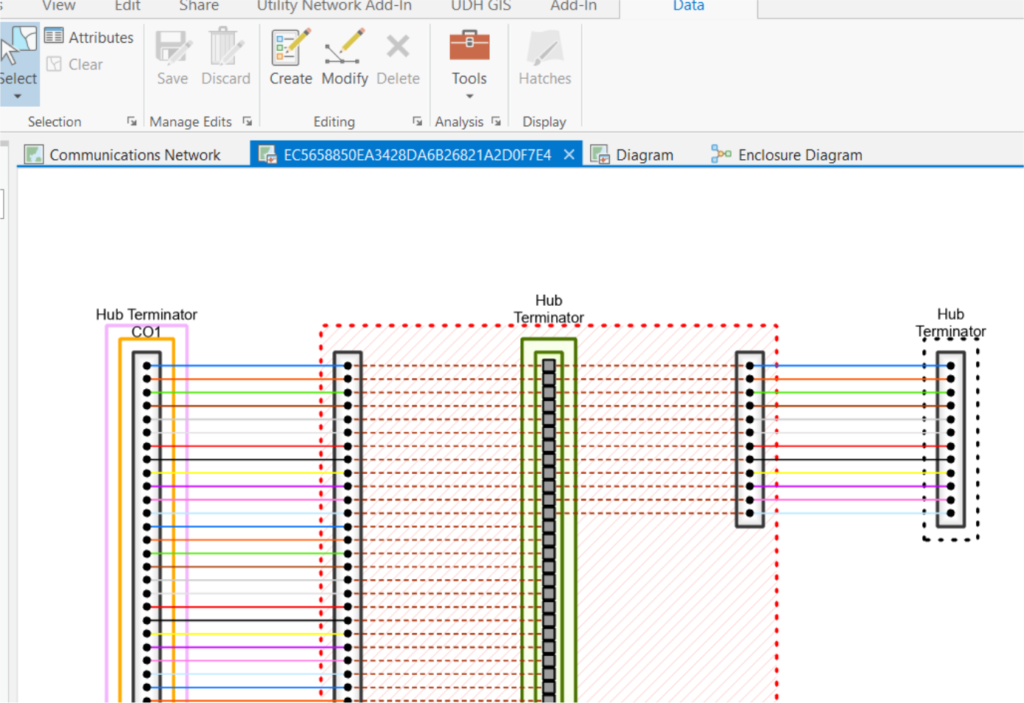
Critical to communications design and installation workflows is the need to manage fiber connections. The AUD Connection Manager has been developed as a portable application that runs both in AUD, as well as ArcGIS to support the design and operational management of fiber connections. Views of the interfaces in both AUD and ArcGIS professional are shown below.
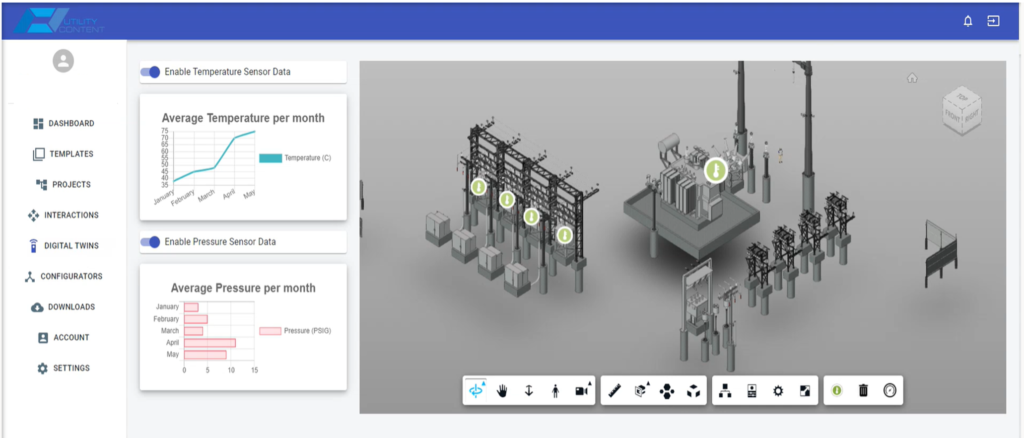
Robust Digital Twin Support
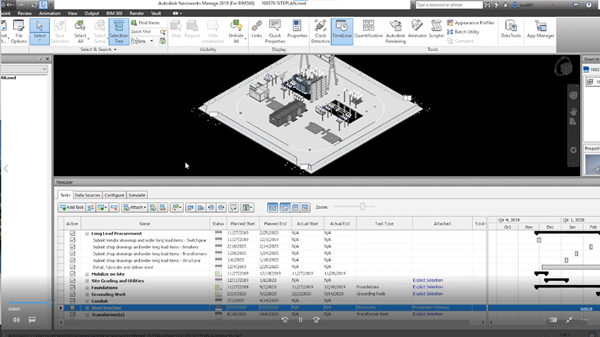
The model-based design capabilities of AUD provide 3D representations of specific instances of real-world communications objects. They also include relationships with other objects as well as network topology. These models are true digital twins and they are created as a normal part of a communications organization’s design and management workflows. In addition to providing more accurate, properly engineered and detailed designs, the use of digital twins enables an extensive set of applications that leverage this information. These include digital construction (also known as BIM), improved asset management, asset analytics and augmented reality.
The following example shows a 3D representation of a patch panel that has been designed in AUD. The panel was originally modeled in 3D, but is typically represented as 2D data in traditional schematic diagrams. The 3D approach provides a unique way to visualize connections and improve accuracy during the design process.
SBS has chosen to leverage Esri’s capabilities to auto-generate schematic representations, further supporting the concept of a single source of truth, no matter what tool is used to create and manage network information. An example is shown below.
A Highly Flexible and Productive Design Tool
While this post has discussed a few of the new capabilities of AUD for Communications it is important to highlight that AUD remains a highly flexible and productive tool for the design of networked infrastructure. It is not uncommon for users to experience 20% to 40% improvement levels in productivity while still improving design quality and reducing field construction issues. Please look at the SBS blog for examples of posts that highlight these capabilities.
In Conclusion
We hope you are as excited about AUD for Communications as we are. You can learn more by viewing our updated Telecommunications StoryMap or visiting www.spatialbiz.com or just giving us a call or email. For those of you who will be attending Esri User Conference 2022 in San Diego please visit us at Booth 1906.